Earth is better ‘Met eish, ja,’ and lots of it

A FUNCTIONAL COLLAPSE?

Earth is better ‘Met eish, ja,’ and lots of it

No one, least of all WILLEM KEMPEN, knows why Antarctic sea ice is at a historic low. But everyone knows what the implications are … and the experts are worried.

Image: ANGELA TUCK

ONE of the reasons you are reading this may be that the words “climate" or “climate change" do not appear in the headline. This is deliberate, because statistics show that many readers lose interest when they see those words. But why?

Everyone likes to talk about the weather, but this enthusiasm rather wanes when it comes to the climate: weather patterns over a longer period. The longer the time frame, the more complex things become, meaning it's even more difficult to know anything with any certainty.

Despite the inherent complexity of the topic, we like to divide people into camps that make things look simple: this one is a “greenie", that one is an “environmentalist", yet another is a “climate-change denier". One says we are on the brink of a catastrophic tipping point that could mean the end of humankind's existence on earth, another says the planet's climate has always changed over time, or that the additional CO2 that has been released into the atmosphere since the industrial revolution can hardly make any difference to our ultimate fate.

Image: MATT PALMER

The first major reason people don't like reading about climate change, or so I suspect, is that part about “making a difference". Yes, you can try to reduce your carbon footprint by doing things like recycling waste, or buying more local produce, or eating less meat (Hi there, Polly/ Hannelore), but most of us occasionally wonder whether “every little bit helps" is really true.

The second big reason so many people are more interested in today's weather than in the change in weather patterns over the past decade is the scarcity of singular  dramatic moments. It's easy to sell media users stories about wildfires, floods, droughts and record temperatures, but the crowds quickly disappear when you start talking about the fraction of a percentage by which some critical number has changed over the past century.

Before you read any further, please bear in mind that I don't really know what I'm talking about when it comes to climate change — even leading scientists don't always know, and they also make mistakes. And every time some expert is publicly wrong about some detail, or exaggerates, or makes invalid inferences, or presents facts out of their proper context, it detracts from the credibility of the larger message.

Moreover, even the most credible message is often mutilated by the time it emerges from a media sausage machine that suffers from the delusion that the public can only understand oversimplified, sensational truths. A good example is this headline on a 2020 CNN story:

Oceans are warming at the same rate as if five Hiroshima bombs were dropped in every second

Image: HUNTER SO

Apart from how scientifically accurate this statement may be, many people's reaction to it will be: well, then it is actually already too late to do anything about it. We might as well carry on as usual.

The underlying problem here is that the climate and how it changes is a so-called “ACAN problem"; it abounds with Asymmetry, Complexity, Ambiguity and Non-linearity. In sausage machine terms: it's bloody complicated.

And because it is so complicated, most scientists can only be an expert on a part of the whole, and the best among them will be careful not to move beyond their own area of expertise, or to try to put complex matters into simple terms. Or to respond to every misrepresentation made in public.

It was with all of these things in mind that I was somewhat surprised last weekend to read a rather dramatic headline to a story by Graham Readfearn in the usually sober The Guardian:

‘Something weird is going on’: search for answers as Antarctic sea ice stays at historic lows

But first, one step back: early in March, in the southern hemisphere's summer, Readfearn wrote in the same publication: “For 44 years, satellites have helped scientists track how much ice is floating on the ocean around Antarctica’s 18,000km coastline. The continent’s fringing waters witness a massive shift each year, with sea ice peaking at about 18 million km2 each September before dropping to just above 2 million km2 by February. But across those four decades of satellite observations, there has never been less ice around the continent than there was last week."

This low point of 1.92 million km2 was recorded on February 25, and is the least ice recorded since satellite observation of the Antarctic seas began in 1979.

10-year averages between 1979 and 2018 and yearly averages for 2012, 2014 and 2023 of the daily (a) ice extent and (b) ice area in the southern hemisphere and a listing of the extent and area of the current, historical mean, minimum and maximum values in square km.
Image: NASA
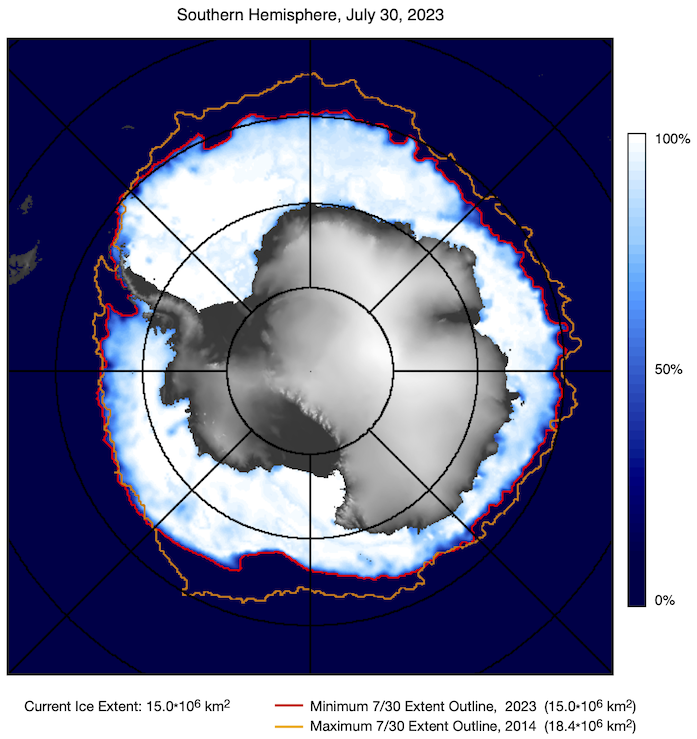
Colour-coded map of the daily sea ice concentration in the southern hemisphere for July 30, along with the contours of the 15% edge during the years with the least extent of ice (in red) and the greatest extent of ice (in yellow) from November 1978 to the present. The extents in km² for the current and for the years of minimum and maximum extents are provided below the image. The different shades of grey over land indicate the land elevation, with the lightest grey being the highest elevation.
Image: NASA

But now, five months later and with another month before the traditional peak in frozen sea surface area normally reached at the end of winter, there is still drastically less ice than expected. Readfearn notes that a typical figure for the end of July is around 16.4 million km2, but last week it was only 14.1 million km2. This means the sea water over an area larger than Mexico did not freeze and form ice as usual.

It was this observation that caused the rare dramatic moment in climate studies, and which made The Guardian's headline possible.

“‘Unprecedented’ is a word that gets bandied around a lot, but it doesn’t really get to just how shocking this is,” one scientist told Readfearn. “It is very much outside our understanding of this system.”

Another said: “There’s a sense that something weird is going on. It’s dropping way below anything we have seen in our record.”

Ten-year averages between 1979 and 2018 and yearly averages for 2007, 2012 and 2023 of the daily (a) ice extent and (b) ice area in the northern hemisphere and a listing of the extent and area of the current, historical mean, minimum and maximum values in square km.
Image: NASA
Seasonal cycle of northern hemisphere sea ice extents (a) and areas (b), given as daily averages, for the years 2012 to 2023. The vertical line represents the last data point plotted.
Image: NASA

Part of the puzzle is that Antarctica's sea ice remained stable until 2016 even though temperatures in the world's oceans continued to rise on average, unlike in the northern Arctic seas, where the ice has steadily decreased. Then, after a record high in Antarctica just two years earlier, there was suddenly a record low, and it's been declining ever since. The debate continues among scientists about what exactly causes this.

Some of them believe global warming reached the tipping point in 2016, when the natural conditions that have always protected the Antarctic ice were no longer sufficient. Others say no, it's more complicated than that. All sorts of factors play a role, such as wind direction and speed, storms, air temperatures, changes in sea temperatures, the salt levels of the sea water and how different temperature layers of the sea mix. As for warmer oceans elsewhere on the planet, one theory even suggests that cyclic phase changes in the earth's core of nickel and iron are  conducting more heat to the deepest parts of the oceans than was the case, say, a century ago.

There is a fair consensus among scientists that human activity is at least part of the cause of what is happening, but some believe there must be other reasons as well, and in any case, they are trying to understand exactly what mechanisms might be at work. In the case of Antarctica's sea ice, for example, one explanation is that the salt content of the upper layers of the seawater has increased, causing it to mix with the layers further down, which in turn causes warmer water to reach the surface, making it harder for ice to form. But the question then remains: what caused the salt content to increase in the first place?

Image: LESLY DERKSEN

Less Antarctic ice could have several far-reaching consequences, but the one several climate scientists are most concerned about is that the sea ice also protects the ice on land from the onslaught of the ocean's waves. Without that protection, more ice could break off land and end up in the oceans, thereby causing a rise in sea levels elsewhere on the planet.

Regarding this, Dr Will Hobbs of the Australian Antarctic Program Partnership told Readfearn: “I’m genuinely worried. As a scientist, I’m worried that I can’t find the answers, or that we might have missed something. And it feels like the stakes are very high in getting this wrong.

“If — and it’s a big if — this is a functional collapse of the system, it means we need to reappraise our sea level projections, and that affects a lot of people. These are the stakes we are playing for. As scientists, we have a real responsibility not to mess this up.”

I like this kind of statement by a respected scientist: the recognition of complexity, ambiguity and the unpredictability of the bigger picture, and that a slight change somewhere does not always have the consequences we foresaw. And I like the acknowledgment of fallibility, and that we may still be far from fully understanding what is happening around us.

But most of all, his message really, really worries me.

 VWB 


BE PART OF THE CONVERSATION: Go to the bottom of this page to share your opinion. We look forward to hearing from you!

Speech Bubbles

To comment on this article, register (it's fast and free) or log in.

First read Vrye Weekblad's Comment Policy before commenting.